CASYvivo
Web-based Application
Redesigned the software integrated into the CASY device, transforming it into a web-based application optimized for touchscreen interfaces.
PROJECT
OLS Omni Life Science
Lunched March 2024
Objective
The new CASY Software comes in 2 versions. The Control-Version includes all functions to control the instrument and also allows analysis of the generated data. The Analysis-Version equals the other version but without the instrument control module.
Highlights of the new software:
- User Management (2 different user levels)
- Analysis of single measurements, Overlays or even Mean results
- Unlimited number of templates
- Organized results
- Reporting tools (customizable)
- User Support by wizards, like start up or shut down guide
Process
User Research
Design
Iteration
Outcome
CSAT (user Satisfaction Score): 90% of users rated, via surveys, their experience 4 or 5 out of 5 after the redesign.
SUS (System Usability Scale): score of 84.5, indicating excellent usability and strong user confidence in the redesigned experience.
research

Finding:
- Additionally, the scientists need a personal space to review information and data on screen.
- Also, I found it very difficult for scientists to manage data scattered between paper, desktop computers, and labs, and redundant data entry. These difficulties increased error rate in data, made scientists inefficient, and contributed to a generally unsatisfying experience.
- To have a more free accessibility to all the lab space and sometimes to control the device or having access to data out of the lab, the possibility of multidevice app seems important.
- On the old software, technician need to have access to some feature that has been impossible, giving access to all these features and elements on one screen is requested by users.
Design Process
UI Audit: Existing CASY Interface
The current state of the software has been analyzed to find out the problem.
- Mapped colors, buttons, sidebars, and pop-ups for consistency review.
- Found overlapping color palettes and unclear hierarchy.
- Noted irregular behaviors on button states and hover.
- Observed spacing and alignment issues in layouts.
- Identified redundant menus and unclear labels.
- Highlighted need for unified design language and scalable system.
Design System
First iteration, the focus of the design has been on the result of the research and analysis.
Interaction Flows
Shown below are two representative flows illustrating how users interact with CASY during core lab tasks.
.png)
.png)
Iteration
Problem - Status Quo - Scrolling
The application has been tested in each sprint with the laboratory technicians and Scientists to find out the best solution.
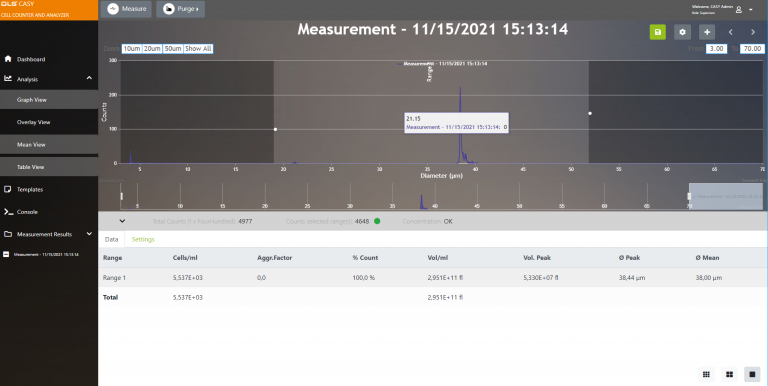
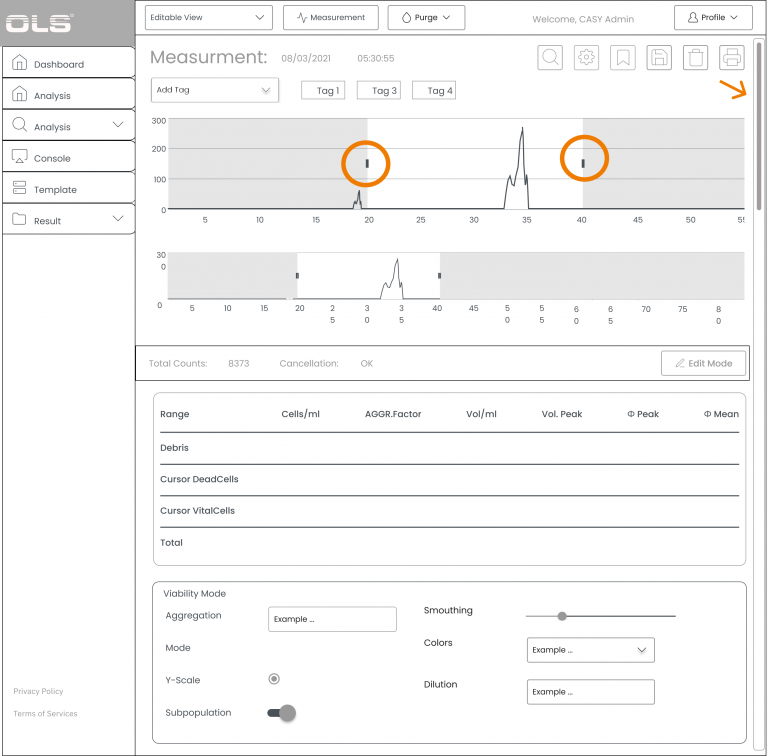
One of the issues that came out after testing, was users interactions with the measurement function. Users report they need to see the data chart and the graph simultaneously on the page. Scrolling in page or between tabs in order to have access to different settings is decrease their efficiency.
Iteration 1 - Lo Fidelity - Range Cursor
Iteration 2 - Lo Fidelity - Navigating Through Tabs


Iteration 3 - Hi Fidelity - Squeezing the graph
.png)
.png)
.png)
CASYvivo
Stakeholders Management
